Paid plugin
RevedaPlot
EUR 7.99/month
This plugin is available as a commercial add-on for Revolution EDA.
RevEDA Plot Plugin
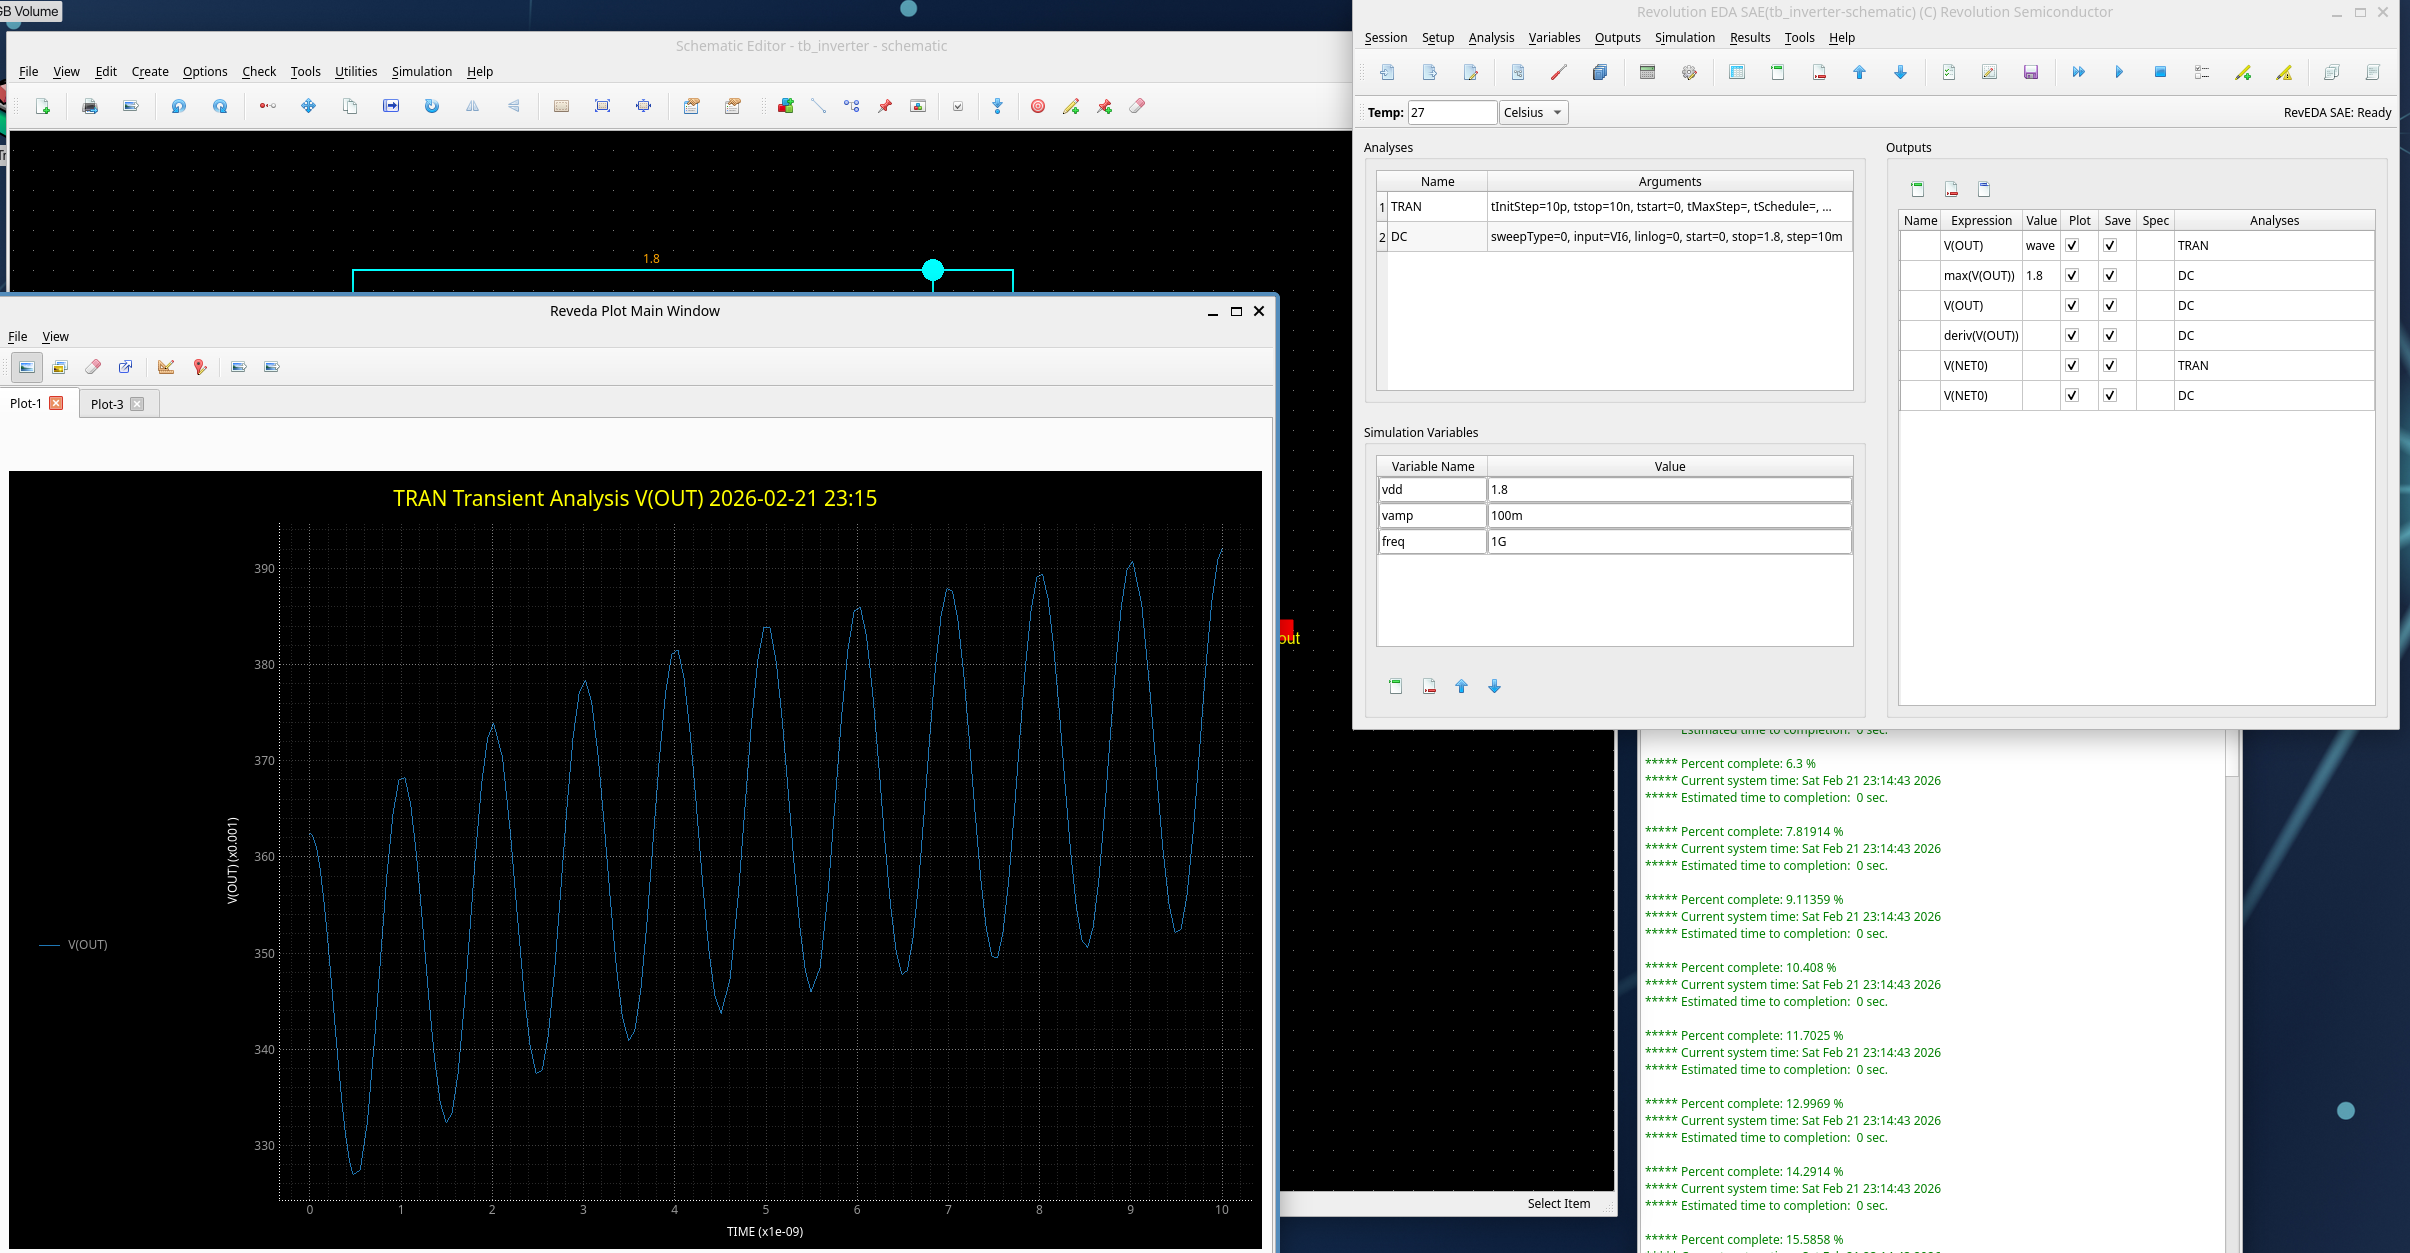
RevEDA Plot (revedaPlot) is an advanced waveform visualization and analysis plugin for Revolution EDA that provides interactive plotting capabilities for circuit simulation results. It features a modern PyQtGraph-based interface with support for multi-dimensional data visualization, parameter sweep plotting, real-time measurement tools, and high-quality plot export functionality, seamlessly integrating with the revedasim plugin for comprehensive simulation workflow.
Features
Visualization Capabilities
- Interactive Waveform Plotting: Real-time zoom, pan, and measurement on simulation waveforms
- Multi-Plot Support: Combined and separate plot views for different signal types
- Parameter Sweep Visualization: Automatic plotting of parametric simulation results with clear parameter identification
- Data Frame Integration: Native support for Polars DataFrame structures for efficient data handling
- Dynamic Plot Updates: Live plot updates during simulation execution
- AC Signal Detection: Automatic detection of complex signal pairs (Re/Im) with magnitude and phase display
User Interface
- Tabbed Interface: Multiple plot tabs for organizing different analyses and results
- Customizable Layouts: Flexible plot arrangement with resizable panels
- Interactive Legends: Clickable legends for signal visibility control with repositionable legend box
- Context Menus: Right-click access to plot operations and settings
- Measurement Tools: Built-in cursors, markers, and measurement capabilities
- Plot Data Dock: Dockable panel listing available data columns for quick plotting
- Recent Files: Quick access to the last 4 opened data files
Plot Types and Formats
- Time-Domain Plots: Transient analysis results with time-based x-axis
- Frequency-Domain Plots: AC analysis with automatic logarithmic frequency scale
- Parametric Plots: DC sweep and parameter variation visualization
- Noise Plots: Noise spectral density visualization
- Harmonic Balance: HB frequency-domain and time-domain analysis results
- Combined Plots: Multiple signals on single plot with automatic color cycling
- Separate Plots: Individual plots for each signal with independent Y-axis scaling
Measurement and Analysis
- Vertical Line Cursor: Draggable vertical line with interpolated Y-values at each curve intersection
- Horizontal Line Cursor: Draggable horizontal line with interpolated X-values at each curve intersection
- Marker Mode: Triangle markers that snap to the nearest data point
- X-Axis Zoom: Click-and-drag zoom on the X-axis (shortcut: X)
- Y-Axis Zoom: Click-and-drag zoom on the Y-axis (shortcut: Y)
- Rectangular Zoom: Box-select zoom on both axes (shortcut: Z)
- Fit All: Auto-scale to show all data (shortcut: F)
- Lines/Points Toggle: Switch between continuous lines and discrete point markers
Signal Calculator
The built-in Signal Calculator (Tools → Signal Calculator, Ctrl+K) provides:
- Expression Evaluation: Evaluate mathematical expressions on plotted signals
- Complex Operations:
db,mag,rad,deg,psd - Scalar Reductions:
max,min,ave,rms,pp - Value Lookups:
yvalue,xvalue,slope - Column Transforms:
integ,deriv,dft,log,log10,exp,power,smooth,sqrt,abs,inv - Arithmetic: Addition, subtraction, multiplication, and division between signals
- Parametric Sweep Support: Evaluate expressions across all sweep runs
- Expression History: Recall previously evaluated expressions
- Direct Plotting: Plot calculated results immediately or add to the data list
Export and Documentation
- PNG Export: High-quality PNG export with white background (Ctrl+P)
- JPEG Export: JPEG export for compact file sizes (Ctrl+J)
- Plot Annotations: Title and axis labeling with parameter information
- Back Annotation: Annotate simulation results back onto schematic editors
Data Processing
- Polars DataFrames: High-performance columnar data processing
- Binary Raw File Parsing: Direct reading of Xyce binary raw files with complex number support
- ASCII PRN File Parsing: Reading of Xyce ASCII output files with multi-section support
- Parameter Sweep Handling: Automatic extraction of swept parameter names and values from step analysis headers
- SI Prefix Handling: Automatic unit prefix formatting for display
Integration Features
Plugin Architecture
- Seamless Integration: Direct integration with Revolution EDA’s plugin system
- revedasim Compatibility: Automatic data reception from the simulation plugin via the Results menu
- Back Annotation: Display simulation operating point values directly on schematic nets
- Clear Annotations: Remove back-annotated values from schematics
- License Management: Built-in license validation; a valid license is required
Results Menu Actions
The plugin adds three actions to the Results menu in the Simulation window:
- Plot Results: Plot output signals defined in the simulation setup
- Back Annotate: Annotate DC operating point or transient values onto schematic editors
- Clear Annotations: Remove all annotations from related schematic editors
Data Interface
- RAW Files: Xyce binary raw file format with support for real and complex data sections
- PRN Files: Xyce ASCII print file format with multi-section parametric sweep support
- RES Files: Automatic reading of associated .res metadata files for sweep parameter labels
- Data Validation: Automatic data integrity checking and error handling
Supported Analysis Types
- Transient Analysis: Voltage/current vs time waveforms
- DC Sweep Analysis: Voltage/current vs swept parameter
- AC Analysis: Magnitude and phase frequency response (automatic log-scale X-axis)
- Noise Analysis: Noise spectral density visualization
- Harmonic Balance: Frequency-domain and time-domain steady-state results
- Parametric Sweeps: Multi-run results with automatic parameter labeling
User Interface Elements
Main Window
- Plot Canvas: Primary plotting area with interactive controls (PyQtGraph-based)
- Toolbar: Quick access to open, plot mode, markers, export, and clear operations
- Plot Data Dock: Right-side dockable panel showing available signals for plotting
- Tab Widget: Multiple closable plot tabs for organizing different analyses
- Status Bar: Real-time information about plot state and measurements
- Menu System: File, Edit, View, Tools, and Help menus
Keyboard Shortcuts
| Shortcut | Action |
|---|---|
| Ctrl+O | Open Data File |
| Ctrl+T | New Tab |
| Ctrl+P | Export to PNG |
| Ctrl+J | Export to JPEG |
| Ctrl+Q | Exit |
| Ctrl+Shift+C | Combined Plot |
| Ctrl+S | Separate Plots |
| Ctrl+L | Clear Plot |
| Ctrl+M | Toggle Marker Mode |
| Ctrl+K | Signal Calculator |
| Ctrl+V | Toggle Vertical Line |
| Ctrl+H | Toggle Horizontal Line |
| X | X-Axis Zoom |
| Y | Y-Axis Zoom |
| Z | Rectangular Zoom |
| M | Marker Mode |
| V | Vertical Line |
| H | Horizontal Line |
| L | Toggle Lines/Points |
| F | Fit All |
| Esc | Disable all modes |
| F1 | User Guide |
Installation and Usage
The revedaPlot plugin is automatically loaded when Revolution EDA starts. A valid license is required. Access plotting features through:
- Automatic Launch: Plots appear automatically when simulation completes via Results → Plot Results
- Manual Launch: Open data files directly with File → Open Data File (Ctrl+O) supporting .raw and .prn formats
- Back Annotation: Annotate simulation values onto schematics via Results → Back Annotate
- Export Functions: Save plots as PNG or JPEG for documentation
License
Commercial — proprietary add-on to Revolution EDA. A valid license key is required.